
Particle size distribution helps explain how mineral powders, ferroalloys, metal powders and welding fluxes behave during handling, mixing and production. Reliable control combines representative sampling, an understanding of particle shape, a suitable sizing method and verified equipment. This guide covers sieve analysis, laser operation, reference-powder checks, calibration and practical acceptance decisions.
Explore the Quality Control Hub →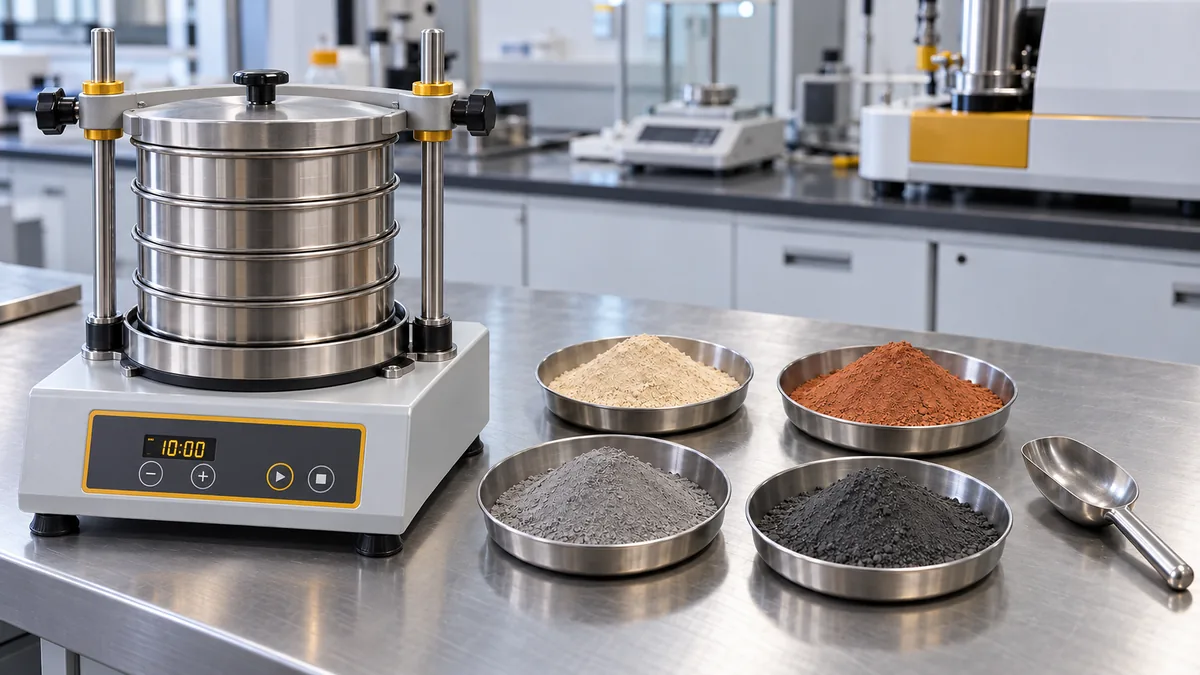
Why Particle Size Matters in Welding Consumables
Mineral powders, ferroalloys and metal powders can meet their chemical specification while differing considerably in particle size. Changes in the fine and coarse fractions can affect handling and processing even when the reported composition remains similar. These effects must be evaluated alongside moisture, particle shape, density and formulation.
| Application | What to Control | Why It Matters |
|---|---|---|
| SMAW electrode coating powders | The size distribution of individual ingredients and the consistency of the prepared blend | Changes can alter binder demand, mixing behaviour and extrusion consistency. Coating quality and welding performance should be checked during qualification. |
| Raw materials for SAW flux production | Feedstock distribution before the relevant mixing, melting or agglomeration operation | Consistent feedstock supports a controlled production process. Its specification is separate from the grain-size specification of the finished flux. |
| Finished SAW flux | The specified granule-size range, including fines and oversize | Grain-size consistency is relevant to feeding, handling and the qualified welding application. |
| FCAW filling powders | Ingredient distribution and blend consistency under the actual feeding conditions | Changes may influence powder flow, segregation and filling stability. Confirmation requires trials on the intended production line. |
Powder Types, Particle Shapes and Size Terminology
Granulometry describes particle sizes and their distribution on a stated basis, such as mass or volume. A complete powder description also identifies particle shape, whether the particles are individual grains or agglomerates, and the condition in which they are measured. These characteristics help explain why powders with similar chemistry and Dv50 values may behave differently.
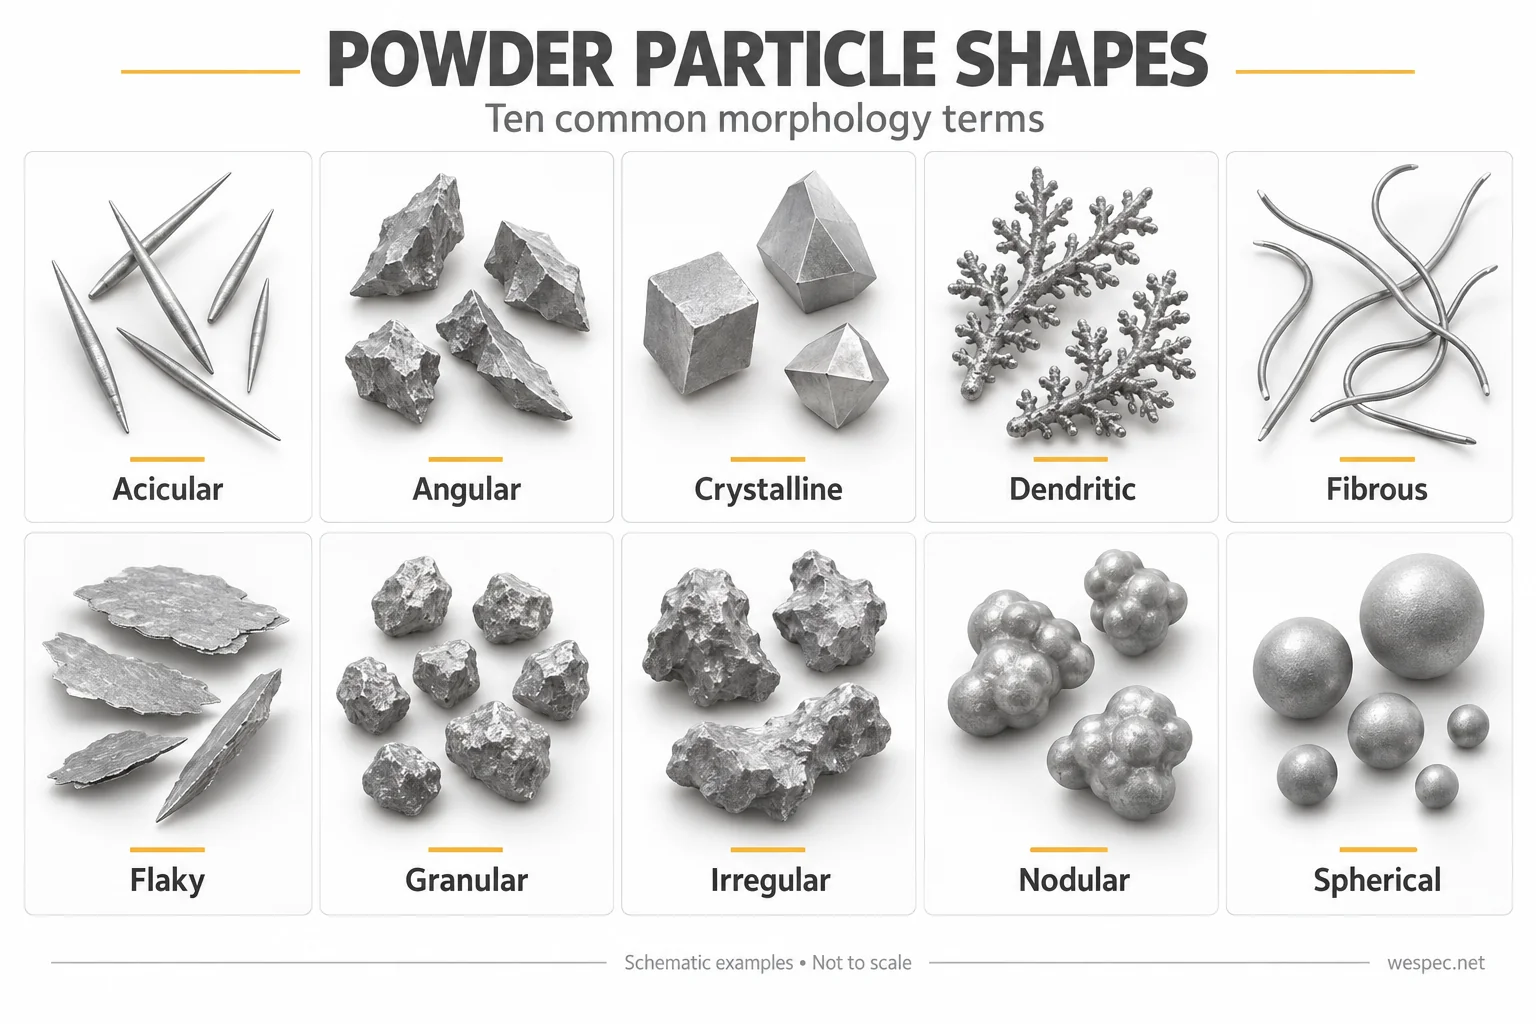
The Ten Particle-Shape Terms Used in the Laboratory Instruction
The supplied procedure lists the following morphology terms. The descriptions below clarify their meaning; they do not assign a fixed shape to every commercial mineral or metal powder. Confirm morphology by an appropriate visual or microscopic examination when it matters to the specification.
| Particle type | Shape description | What to consider during sizing |
|---|---|---|
| Acicular | Needle-like, with length much greater than width. | A sieve opening or equivalent-sphere diameter does not directly measure needle length. |
| Angular | Particles with pronounced edges and corners. | Orientation and passage through an aperture can influence sieve results. |
| Crystalline | Particles showing identifiable crystal faces or crystal habit. | Crystal habit can be non-spherical; this term is not itself a size class. |
| Dendritic | Branched, tree-like particles. | Branches can interlock or break under excessive preparation energy. |
| Fibrous | Long, thread-like particles. | Length, thickness and entanglement need consideration alongside an equivalent diameter. |
| Flaky | Thin, plate-like particles. | Thickness and lateral dimensions differ; orientation affects apparent size. |
| Granular | Grain-like particles without a required perfect spherical shape. | Distinguish individual solid grains from porous agglomerated granules. |
| Irregular | Particles without a consistent regular geometry. | Use a defined sizing method; one diameter does not describe every dimension. |
| Nodular | Rounded, lumpy particles, potentially with an uneven surface. | Rounded appearance does not establish perfect sphericity or smoothness. |
| Spherical | Particles approximating a sphere. | A diameter is more geometrically representative, but sampling and dispersion still matter. |
Descriptive Size Classes in the Source
| Historical descriptive class | Size range in the instruction |
|---|---|
| Boulder | >256 mm |
| Cobble | 64–256 mm |
| Pebble | 4–64 mm |
| Granule | 2–4 mm |
| Sand | 64 µm–2 mm |
| Silt | 4–64 µm |
| Clay | 0.5–4 µm |
These descriptive classes are background terminology from the source, not a welding-powder acceptance specification. Define actual powder limits using the relevant test method and aperture or percentile sizes.
Sieve Analysis or Laser Diffraction?
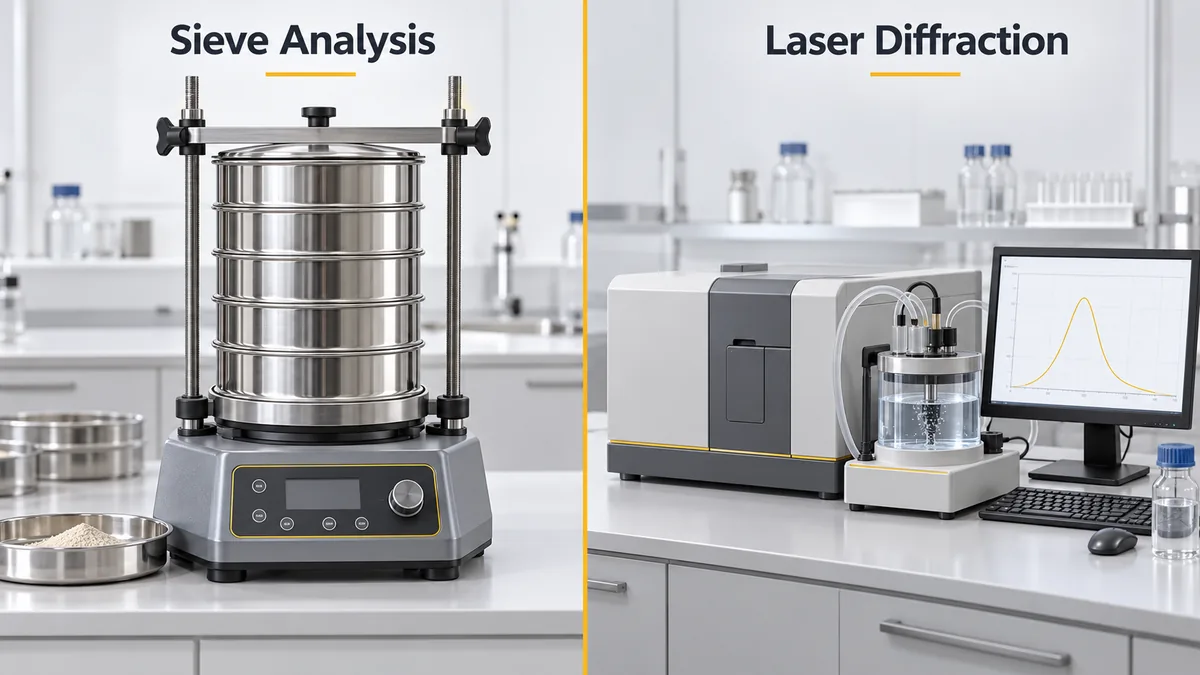
The method should follow the material specification and the manufacturing decision it supports. Sieve analysis and laser diffraction provide different descriptions of particle size; they are not automatically interchangeable.
| Feature | Sieve Analysis | Laser Diffraction |
|---|---|---|
| Measurement principle | Separation through defined apertures | Interpretation of a measured light-scattering pattern using an optical model |
| Typical output | Mass retained on each sieve and cumulative percentage passing | Usually a volume-based distribution and percentile diameters such as Dv10, Dv50 and Dv90 |
| Useful applications | Granular fluxes and powders with a suitable sieve-based specification | Fine powders and distribution monitoring within the instrument's validated range |
| Main controls | Aperture condition, test portion, loading, sieving conditions, blinding and mass recovery | Sampling, dispersion, optical settings, background, concentration and measurement stability |
| Interpretation limits | Particle shape and orientation affect passage; cohesive fines may obstruct apertures | The reported diameter is model-dependent; particle shape and dispersion affect the result |
For irregular particles, the diameter reported by laser diffraction can differ from the aperture size through which they pass. A mass distribution also need not match a volume distribution, particularly in mixtures containing ingredients of different densities. If a supplier reports sieve results and the receiving laboratory uses laser diffraction, establish an agreed comparison procedure before making an acceptance decision.
Use aperture dimensions in micrometres or millimetres and identify the sieve standard. A mesh number alone may be ambiguous because its meaning depends on the sieve system and wire dimensions.
Other Sizing Principles Mentioned in the Source
The instruction also lists sedimentation, centrifugal methods, electrical-resistance methods and a surface/resistance-related method whose label is not sufficiently defined to reconstruct its procedure. These methods respond to different physical properties. Use the actual method definition, material assumptions and calibration evidence before comparing their results with sieving or laser diffraction.
How to Read D10, D50, D90 and Sieve Results
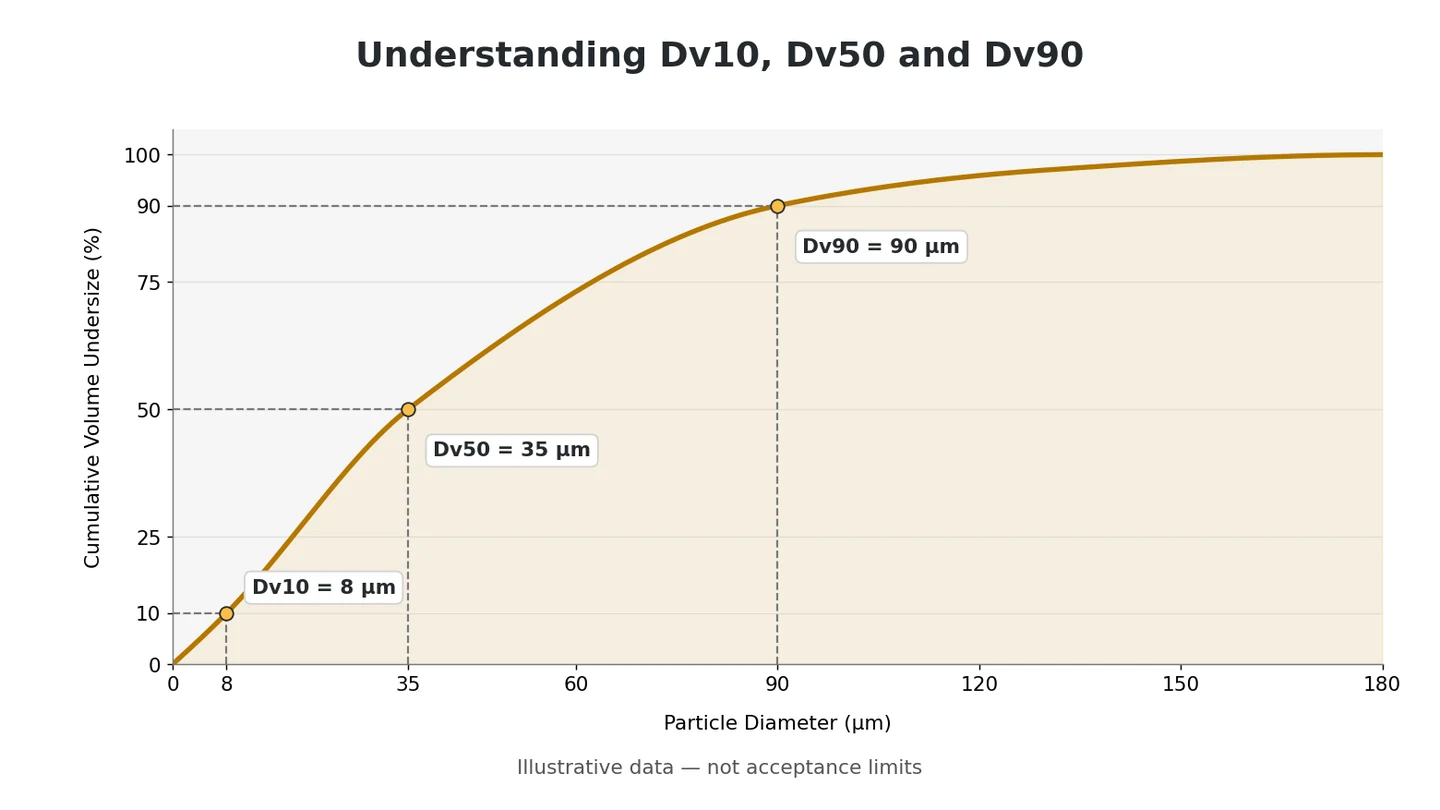
Always identify the distribution basis. For a volume-based laser diffraction result, the notation Dv makes that basis explicit:
- Dv10: the diameter below which 10% of the measured particle volume falls.
- Dv50: the volume median diameter, with 50% of the volume below this size.
- Dv90: the diameter below which 90% of the volume falls.
Dv50 is a median, not an arithmetic mean. Dv90 is not the maximum particle size: a coarser fraction can remain above it. Two powders with a similar Dv50 can have different fine fractions, coarse tails or multiple peaks. Review the complete distribution as well as its selected percentiles.
A Simple Interpretation Example
If a hypothetical powder has Dv10 = 8 μm, Dv50 = 35 μm and Dv90 = 90 μm, 50% of its measured volume lies below 35 μm and 10% lies above 90 μm. These numbers explain a result; they are not recommended acceptance limits for welding-consumable raw materials.
A useful width indicator is span = (Dv90 − Dv10) / Dv50 . For this example, the span is approximately 2.34. Compare it using the same method and dispersion conditions; a narrower distribution is not automatically better for every formulation.
Sieve Calculations
Retained percentage = 100 × mass retained on the individual sieve / initial test-portion mass. Cumulative retained percentage is the sum retained on that sieve and all coarser sieves. Cumulative passing percentage is 100 minus the cumulative retained percentage.
Check the recovered mass, including the pan fraction, against the initial mass. Investigate losses or an unacceptable mass balance before releasing the result. If a reporting procedure normalizes to recovered mass, state this clearly and retain the original mass-balance record.
Optical Models and Additional Software Outputs
The legacy software offers Fraunhofer and Mie evaluation, cumulative undersize and oversize curves, selected percentile sizes, the fraction at a selected diameter and statistical outputs. Retain the optical model and distribution basis with the report. Model selection is part of the method and should not be changed simply to obtain a passing value.
Fraunhofer is an approximation suited to appropriate particle and optical conditions. Mie calculations require suitable optical properties for the sample and dispersion medium at the measurement wavelength. For mixtures, the assumptions need particular attention. Neither model directly measures the length and thickness of every irregular particle.
Any software-derived specific surface area is calculated from the size distribution and associated assumptions about shape and, where required, density. It is not an independent surface-area measurement. A powder with internal porosity or a rough surface can therefore require a different test when actual surface area is the control parameter.
Representative Sampling Comes First
A precise instrument cannot correct an unrepresentative sample. Fine and coarse particles may segregate during transport, vibration, discharge or storage. Taking a small scoop from the surface of one bag may therefore misrepresent the delivery.
- Identify the supplier lot, delivery quantity and package condition.
- Select packages and sampling locations under an approved plan that reflects lot size, heterogeneity and supplier history.
- Collect increments and combine them only when a composite is appropriate for the inspection objective. Keep separate samples when investigating between-package variation.
- Reduce the gross sample using a suitable splitter or a validated division procedure. Confirm that fines and coarse particles remain represented.
- Prepare the test portion and keep an identified retained sample where required.
Do not grind a sample intended to show the as-received distribution. A portion ground for chemical analysis is generally unsuitable for that purpose. Prepare separate portions for chemical analysis and particle sizing.
See the practical foundations in Sampling and Sample Preparation .
A Practical Particle Size QC Procedure
1. Confirm the Specification and Method
Check the material grade, specification revision, required size fractions and agreed test method. Confirm whether the result is needed for incoming acceptance, process monitoring or finished-product release.
2. Verify Equipment Readiness
For sieve analysis, verify sieve identification, aperture condition, cleanliness and the status of the balance and shaker. For laser diffraction, check the optical system, measurement cell, background and relevant instrument performance checks. Use suitable reference materials with documented values and acceptance criteria.
Routine verification, instrument calibration and maintenance are separate activities. Set their frequency through the laboratory quality system, manufacturer guidance, usage and performance history. Repeat relevant checks after repair or adjustment.
3. Run the Approved Test
For sieving, control test-portion mass, sieve loading, sequence, shaking conditions and the defined endpoint. Avoid excessive loading, blocked apertures and unnecessary attrition. Clean sieves using a method appropriate to their construction.
For laser diffraction, use a validated wet or dry dispersion method. With wet dispersion, choose a compatible medium and control circulation, dispersion time and any ultrasound. With dry dispersion, control feeding and dispersion pressure. Check background and use an appropriate concentration range for the material and instrument.
Where the optical model requires refractive-index and absorption inputs, document the selected values and assess their suitability. Do not apply one instrument's obscuration target, ultrasound setting or scan count to every powder.
4. Check Repeatability and Sample Preparation
Repeated readings from one suspension help assess measurement stability. Independently prepared portions provide a stronger check on sample preparation and division. Set repeatability criteria during method validation and monitor the parameters relevant to the decision, including the coarse tail.
When results disagree, investigate before averaging. Possible causes include segregation, poor wetting, settling, agglomeration, sieve blinding, contamination or particle breakage. Preserve the original results and document any justified exclusion.
5. Review and Record the Result
Compare the validated result with the current specification, retain the distribution or sieve-fraction data and record the release decision. A laboratory result supports the decision; material release remains the responsibility of the authorized quality function.
Operating a Laser Particle Sizer: The FRITSCH Example
A validated operating method must connect sampling, liquid compatibility, dispersion, optical setup and data review. The following worked example incorporates the detailed FRITSCH procedure in QWI-LA-02, revision 00. Its instrument settings are historical examples for that installation, not universal settings for every powder or current instrument.
The legacy FRITSCH Laser Particle Sizer Economy uses ANALYSETTE 22 software, a helium–neon laser of 632.8 nm with stated power below 3 mW, and a semicircular concentric detector arrangement. Its documented range is 0.1–600 µm. Those specifications belong to this older configuration and must not be applied to every current ANALYSETTE model.
Routine preparation and measurement
- Divide representatively. Use an appropriate sample divider, especially for mixtures containing approximately 100 µm particles and 10–20 µm fines. The source describes a local workflow using a 90 µm sieve cut; retain and account for the oversize if that workflow is used.
- Condition the instrument. The legacy procedure specifies 10–15 minutes of standby. Check the tank, cell, laser, computer and associated equipment. Use the Clean/Fill functions with suitable hardness-free water from the external tank and its controlled filling valve.
- Check the background and beam alignment. The local procedure specifies a signal above 2.5 V. This is an instrument-specific diagnostic threshold, not a universal laser-diffraction criterion.
- Establish stable dispersion. Pump, stirrer and ultrasound can be controlled manually or through software. The source describes an ultrasound scale up to 100 and a 5% sodium pyrophosphate dispersant solution. Pump and stirrer settings must maintain representative suspension without excessive bubbles or particle damage. Validate the actual scale, dose and compatibility; do not assume 5% is the final suspension concentration. Avoid dissolving, reacting with or breaking the particles being measured.
- Select range and scan settings. The legacy software supports Single Range, Multiple Range and Autorange. It describes 31 detector channels and 62 channel observations at two cell positions. Moving the cell changes the accessible scattering angles and size coverage; closer positions are used for finer-particle information.
- Set the appropriate sample loading. The source targets a displayed Sample Dilution value of 13–18%. Treat this as the legacy instrument's loading/optical indicator, not a solids mass percentage. Confirm its definition and target for the installed system.
- Measure three times. Choose acquisition time with dispersion stability and settling in mind. The source discusses a scan setting range of 5–25 and describes longer scans for fine material and shorter scans for coarse material. These are legacy software settings; do not assume the numbers are seconds without confirming the installed software. Confirm that the chosen timing gives representative repeatable readings.
- Save, compare and clean. Retain all distributions and settings, overlay repeat curves and investigate discrepancies. The original FDD/floppy-save instruction is an obsolete storage implementation; use controlled digital records and backups. Clean and refill between incompatible samples.
Validate the Dispersion Medium and Energy for Each Powder
Hardness-free water is the medium described for the local installation, but water is appropriate only when the sample remains chemically and physically stable in it. Confirm wetting, compatibility and suspension stability for each material family. Record the dispersant identity, solution concentration, actual dose and dispersion time.
Observe how the distribution changes with controlled dispersion. A shift to smaller sizes may indicate deagglomeration, but it can also indicate fracture or dissolution. A stable result should represent the agreed measurement target. Do not use the BCR reference-powder ultrasound setting automatically for finished flux granules or a fragile ingredient.
When a Sieve Cut Is Used Before Laser Analysis
The source describes separating material above 90 µm for certain broad distributions. That is a specific preparation route, not a mandatory limit of laser diffraction. If used, record the starting mass and separated fractions. Report the laser result explicitly as the fraction below the cut; do not label its percentiles as those of the complete delivery.
Combining sieve and laser data into one full-distribution result requires a validated calculation with compatible mass or volume bases and appropriate density information. Simply joining two curves at 90 µm is not sufficient.
Laser Particle Sizer Calibration and Reference-Powder Verification
Calibration, verification and adjustment have different purposes. A reference-powder check demonstrates whether the system meets defined criteria under a specified method. It does not authorize an arbitrary correction to every future particle-size result. Verify the instrument together with its dispersion and calculation settings.
Reference-powder verification and cell maintenance
The source calls for dismantling and cleaning the cell and holder about monthly, sometimes twice monthly when contamination warrants it, followed by a performance check. Optical deposits are a major potential source of error. Follow the approved service procedure to avoid disturbing alignment or damaging optical surfaces.
The documented primary quartz references are BCR 67, 2.4–32 µm , and BCR 69, listed as 14–90 µm on one page and 12–90 µm on the next . Use the actual certificate to resolve that inconsistency. Secondary powders require reliably assigned distributions and documented stability.
The documented BCR 67 verification sequence
- Select Single Range and set the legacy cell distance to 60 mm.
- Wash the circulation system and add the prescribed sodium pyrophosphate dispersant (Na 4 P 2 O 7 ).
- Enter the sample parameters, set the scan entry to 20, and select the legacy option labelled “Calculation independent of model.” The label does not mean laser sizing is physically assumption-free.
- Set pump to 85%, stirrer to 50% and ultrasound to 100% on that instrument's controls.
- Measure the background and add reference powder to approximately 13% on the Sample Dilution display.
- Temporarily stop pump, stirrer and ultrasound as described for bubble removal, then restart at the stated settings.
- Acquire three readings and compare the curves and certified percentile limits.
The source gives a BCR 69 example with an acceptable 10th-percentile size of 17.1–20.1 µm. That interval belongs to the cited reference example and must be checked against the actual certificate and distribution basis. Compare d10, d50 and d90 and the full curve where provided. Although the instruction mentions a correction factor after disagreement, do not apply an arbitrary multiplier to force a passing distribution. Investigate dispersion, loading, bubbles, cell cleanliness, settings and reference integrity, then use only a validated adjustment.
What the Source Does and Does Not Establish
The local instruction refers to its FRITSCH reference manual for additional calibration instructions and certified comparison curves. Those referenced manual pages and complete reference-material certificates are not included in the supplied 16-page document. Use the actual certificate for the powder in hand, including batch, measurement basis, assigned percentile values and permitted intervals.
One preparation passage describes 500 µm material as “very fine,” which is inconsistent with its surrounding discussion. That isolated wording is not used here as a preparation criterion. The explicit measuring range, validated method and actual sample distribution take precedence.
Document and Retain the Verification Evidence
For each check, record the reference identity and batch, certificate, preparation, cell position, range, optical model, background, scan setting, loading indicator, pump, stirrer, ultrasound, individual readings and comparison decision. Preserve full curves and any technically justified exclusions. Repeated readings of one suspension assess short-term stability; independently prepared portions also test division and dispersion.
The laser section assigns implementation to chemistry-laboratory analysts, specifies review of the instruction every six months and retention of its records for at least six months. These are the original local administrative requirements. Apply the current laboratory's approved retention policy and a check frequency supported by risk, use, reference stability and instrument history.
Test-Sieve Calibration, Reference Powders and Maintenance
A sieve is a measuring device: its identity, aperture condition and verification status directly affect the reported fraction. The supplied procedure establishes traceability from externally calibrated master sieves to reference powders and then to working sieves used in routine laboratory tests.
Prepare a master sieve series appropriate to the laboratory's materials and obtain external calibration from a competent provider. Use those master sieves to prepare reference powders with assigned grading and defined acceptance ranges. Store the powders in closed, labelled containers, then use them to evaluate working sieves at the local six-month interval. This is a working-sieve performance comparison; it is not automatically equivalent to direct dimensional certification of every opening.
Legacy sieve inventory
The following aperture/mesh pairs are reproduced from the laboratory inventory. Specify the aperture in µm or mm and the applicable sieve standard when ordering or reporting; a mesh number by itself is not a universally unique aperture.
| Application | Mesh designation in source | Nominal aperture, mm |
|---|---|---|
| Raw materials | 120 | 0.125 |
| Raw materials | 25 | 0.710 |
| Raw materials | 35 | 0.500 |
| Raw materials | 45 | 0.355 |
| Raw materials | 60 | 0.250 |
| Raw materials | 80 | 0.180 |
| Raw materials | 170 | 0.090 |
| Raw materials | 230 | 0.063 |
| Raw materials | 325 | 0.045 |
| Fluxes | 12 | 1.70 |
| Fluxes | 18 | 1.00 |
| Fluxes | 20 | 0.850 |
| Fluxes | 30 | 0.600 |
| Fluxes | 35 | 0.500 |
| Fluxes | 40 | 0.420 |
| Fluxes | 50 | 0.300 |
| Fluxes | 70 | 0.212 |
Reference-powder storage, labels and records
The source specifies sealed glass containers on laboratory shelves, relative humidity no greater than 65% and temperature no lower than 10°C. These are local storage limits, not a universal guarantee of powder stability. Protect each material against moisture pickup, contamination, segregation and agglomeration.
Labels include powder code, assigned size, accuracy and measuring range, preparer, preparation date, expiry and any additional laboratory-approved information. After a successful working-sieve check, apply its verification label and record the assessment on F-CA-03. The specified local retention period is one year.
Cleaning and disposition of damaged sieves
Inspect and clean before each use. The legacy instruction mentions wire brushes, pin-like gauges for blocked openings above 500 µm, and compressed air below 500 µm. These techniques can damage or enlarge a mesh if applied incorrectly and should not be copied as a general cleaning method. Use the sieve manufacturer's approved cleaning procedure; guidance from Endecotts favors plastic-bristle brushing for coarser meshes and ultrasonic cleaning for fine meshes. Do not force particles or tools through the openings.
If a sieve fails and cannot be restored and reverified, remove it from analytical quality control. The source allows clearly labelled transfer to a noncritical use requiring lower accuracy, or rejection and disposal where no such use is suitable. A restricted-use label must not permit the sieve to re-enter material-release testing.
Keep the Working-Sieve Comparison Reproducible
- Confirm the working sieve ID, aperture, construction and assigned reference-powder range.
- Inspect cleanliness, tension, visible damage and the connection between mesh and frame.
- Test an identified reference portion using controlled loading, shaker settings and endpoint.
- Compare the retained or passing fraction with the assigned reference limits and check mass recovery.
- Record the raw masses, result, acceptance decision, operator, date and next check; label the sieve's status.
- If the result fails, investigate the sieve and reference powder before repeating. Restore and reverify the sieve or withdraw it from release testing.
The document does not supply one numerical allowable error for every sieve. Derive working acceptance limits from the master-sieve evidence, assigned reference-powder performance, the applicable sieve requirements and the intended decision. Likewise, balance checks and shaker controls require their own approved procedures; the source does not contain complete calibration instructions for those instruments.
Troubleshooting and the Equipment Control Plan
Investigate discrepancies through the complete measurement chain. Do not average conflicting results or modify a calibration factor until the reason has been assessed.
| Observed problem | Possible cause | Practical investigation |
|---|---|---|
| Different test portions give different curves | Segregation, nonrepresentative division or too small a portion. | Review the sampling and splitter procedure; test independently prepared portions. |
| Coarse tail changes during circulation | Settling, insufficient mixing, bubbles or changing agglomeration. | Check suspension transport, circulation and bubble formation before changing the model. |
| Size decreases with longer ultrasound treatment | Deagglomeration, particle fracture or dissolution. | Check the intended particle condition and validate the treatment duration and energy. |
| Reference and sample curves shift after maintenance | Cell alignment, contaminated optics, changed software settings or dispersion. | Verify background, cell position, stored method and reference material before release. |
| Background is high or unstable | Dirty cell, contaminated medium, residual sample or bubbles. | Clean and refill; establish an acceptable stable background before sample addition. |
| Poor repeatability at high sample loading | Unsuitable optical loading or unstable dispersion. | Adjust loading within the validated method; do not equate optical display percentage to solids mass percent. |
| Unexpected sieve retained fraction | Blinding, damaged openings, overload, agglomerates or changed shaking conditions. | Inspect sieve status and check reference powder, loading, endpoint and recovered mass. |
| Working sieve fails a reference check | Sieve damage or change in the reference powder. | Assess both; remove the sieve from release testing until acceptable performance is demonstrated. |
| Good repeatability but disagreement with the reference | Systematic method bias, incompatible reporting basis or incorrect reference values. | Check certificate, optical model, preparation and reporting basis; repeatability alone does not establish accuracy. |
Equipment Checks and Records at a Glance
| Control | Frequency or trigger in the source | Evidence to retain |
|---|---|---|
| Laser readiness | Before measurement: condition, fill, background and alignment. | Instrument status, background and approved method settings. |
| Laser repeat measurements | Three readings in the described routine and reference workflows. | Individual readings, overlays and reasoned review of differences. |
| Laser cell service | Approximately monthly; twice monthly where sample contamination warrants it. | Cleaning/service record and acceptable verification after intervention. |
| Laser reference check | Recheck after cell service; no universal routine calendar interval is given. | Certificate-based acceptance and preserved distributions. |
| Working-sieve assessment | Every six months in the local procedure. | Reference-powder result, status label and F-CA-03 checklist. |
| Sieve cleaning and inspection | Before each use. | Clean, undamaged and in-date equipment; faults and actions recorded. |
| Reference-powder condition | Check identification, storage condition and expiry before use. | Assigned values, preparation history, container label and stability evidence. |
Setting Acceptance Limits and Handling Nonconforming Material
There is no single particle-size range suitable for every rutile, fluorite, ferroalloy, iron powder or flux. Establish limits from qualified material grades, the formulation, production capability and demonstrated product performance. Supplier data and historical results support this work, but do not replace qualification.
- For sieve-based specifications, define the aperture sizes and permitted retained or passing fractions.
- For laser-based specifications, define the distribution basis, selected percentiles and any limits on tails or particular size bands.
- Identify the test method, preparation conditions and specification revision alongside the numerical limits.
- Define how results close to a limit are reviewed, including relevant measurement uncertainty.
If a result is outside specification, identify and hold the affected material pending review. Check sample identity, equipment status and preparation records. Repeat testing or resampling under the documented investigation procedure rather than testing repeatedly until a passing result appears.
Reprocessing, controlled blending or restricted use may be considered only through an authorized technical disposition with supporting evidence and reinspection. Informal addition to production can conceal the problem and compromise traceability.
When the supplier changes a material grade, milling process or manufacturing site, assess whether renewed qualification is needed. Use Raw Material Quality Control and Chemical Analysis of Raw Materials alongside particle sizing.
What the Test Report Should Include
Record material and supplier identity, lot number, sampling information, test date, operator, equipment ID, method revision, preparation conditions, result basis, units, full distribution or sieve fractions, repeatability checks, specification limits and final disposition. Retain the raw data and link the report to the material's production-use records.
Additional Fields for a Reproducible Result
For laser diffraction, retain cell configuration, range, medium and dispersant, scan entry, pump/stirrer/ultrasound settings, loading indicator, optical parameters, background and reference-check status. For sieve analysis, retain individual sieve IDs, nominal apertures, test-portion mass, raw retained masses, pan fraction, recovery, shaker conditions and endpoint. Link each result to the reference checks and equipment status applicable on the test date.
Frequently Asked Questions
Is a finer powder always better?
No. The preferred distribution depends on the ingredient, formulation and process. Excess fines can create handling difficulties, while excessive coarse material can also cause problems. Confirm the acceptable balance through qualification.
Can Dv50 alone confirm that a powder is acceptable?
No. It may conceal an excessive fine fraction or coarse tail. Review the full curve and the parameters required by the specification.
Can sieve and laser results be compared directly?
Not without evaluating the measurement principles, distribution basis, particle shape and sample preparation. Establish a material-specific correlation if both methods are used.
Should every sample be dispersed in water?
No. The medium must be compatible with the powder. Materials that react, dissolve or swell require another validated preparation route. The method must preserve the particle characteristics being assessed.
Can finished SAW flux be ground before particle sizing?
Grinding changes its granule-size distribution. Use an as-received portion for finished-flux sizing under the agreed method, and a separate portion when grinding is required for chemical analysis.
Does passing a particle-size test guarantee welding performance?
No. Particle size is one control within a wider system that includes composition, moisture, formulation, manufacturing conditions and the applicable finished-product tests.
Does the 13–18% Sample Dilution setting mean 13–18% powder by mass?
No. It is the loading-related display target stated for the legacy instrument. Confirm the software definition; it must not be treated as a solids mass percentage or transferred automatically to another instrument.
Can a BCR reference-powder check use one universal d10 limit?
No. Use the actual reference certificate and measurement basis. The supplied instruction gives a BCR 69 example of 17.1–20.1 µm at the 10th percentile, but that is not a universal limit for other references or raw powders.
Can a correction factor fix any disagreement with a reference?
No. First investigate preparation, optical condition, dispersion, settings and the reference itself. Apply only an adjustment supported by the approved method, then verify the result.
Technical References
Use the applicable edition and the complete requirements when establishing a laboratory procedure. General particle-sizing standards do not supply a universal acceptance range for welding-consumable ingredients.
- ISO 13320:2020 — guidance for laser diffraction particle-size analysis.
- ISO 2591-1:1988 — general principles for test sieving.
- ISO 3310-1:2016 — technical requirements and testing for woven-wire test sieves.
- ISO 14174:2019 — classification of fluxes for submerged arc and electroslag welding.
- Malvern Panalytical: A Basic Guide to Particle Characterization — measurement principles, distribution bases and interpretation.
- FRITSCH: Sample Preparation for Laser Particle Sizing — dispersion and sample-preparation considerations.
- Endecotts: Sieve Analysis White Paper — test-sieve handling and cleaning guidance.